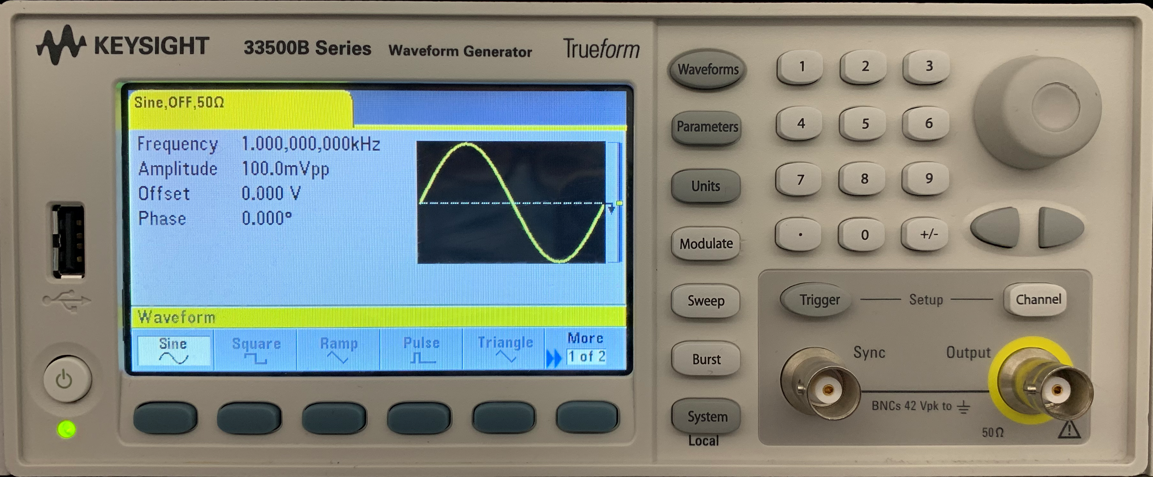
A function generator is a piece of electronic test equipment or software used to generate different types of electrical waveforms over a wide range of frequencies. Some of the most common waveforms produced by the function generator are the sine wave, square wave, triangular wave, and sawtooth shapes. These waveforms can be either repetitive or single shots.

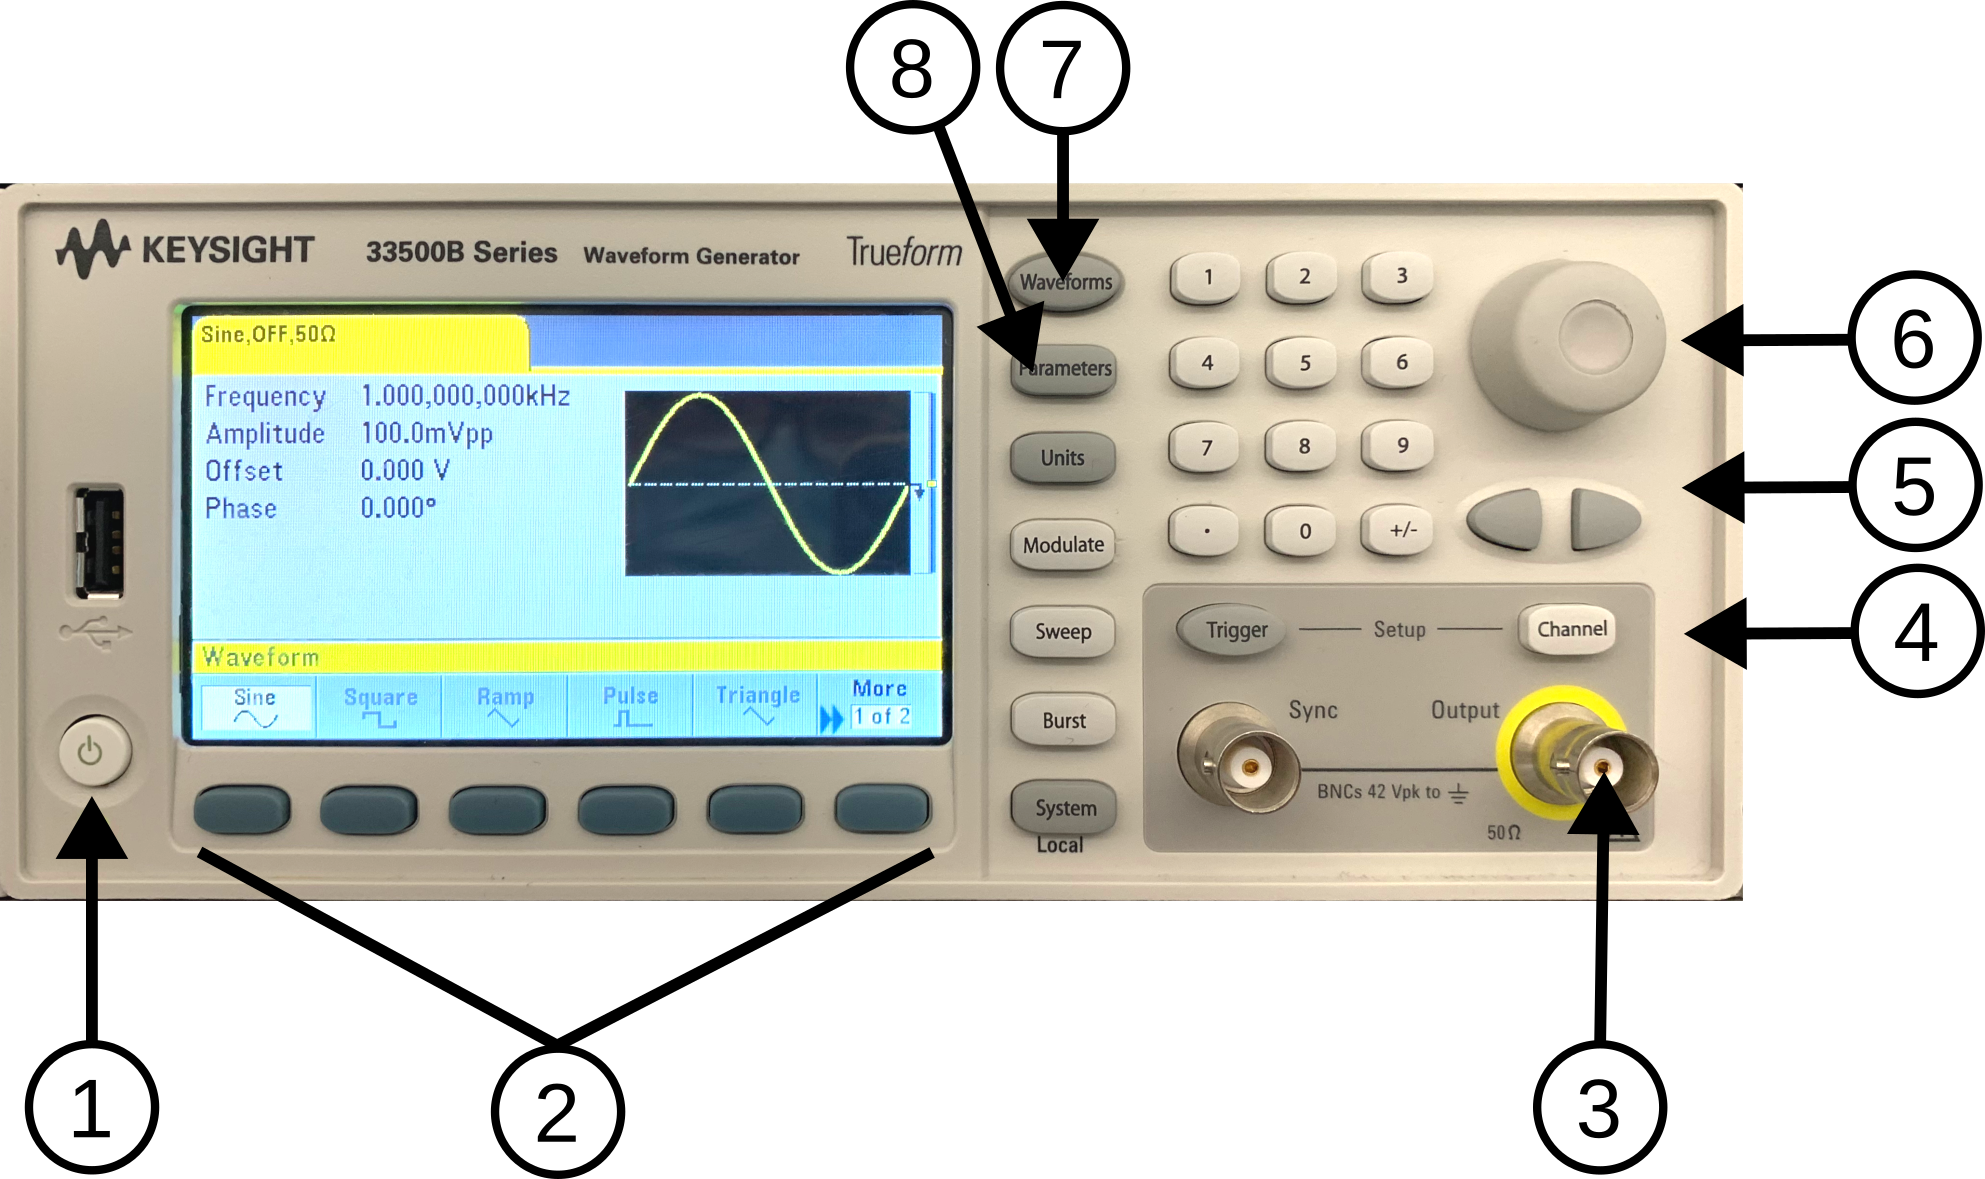
Figure 6.1 Keysight 33500B Function Generator
In the electronics lab, you will be using a Keysight 33500B (or similar) Function Generator. Its manual can be found here: Function Generator Manual
An oscilloscope, or DSO (for the more modern digital storage oscilloscope), is a type of electronic test instrument that graphically displays varying signal voltages, usually as a calibrated two-dimensional plot of one or more signals as a function of time. The displayed waveform can then be analyzed for properties such as amplitude, frequency, rise time, time interval, distortion, and others. Originally, the calculation of these values required manually measuring the waveform against the scales built into the screen of the instrument. Modern digital instruments may calculate and display these properties directly.
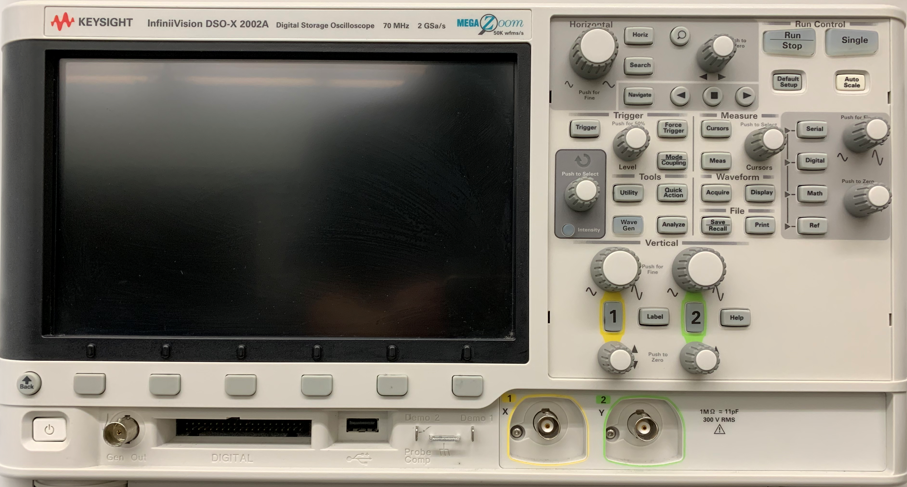
Figure 6.2 Keysight 33500B Function Generator
In the electronics lab, you will be using a Keysight DSO-X 2002A (or similar) Digital Storage Oscilloscope. Its manual can be found here: DSO Manual
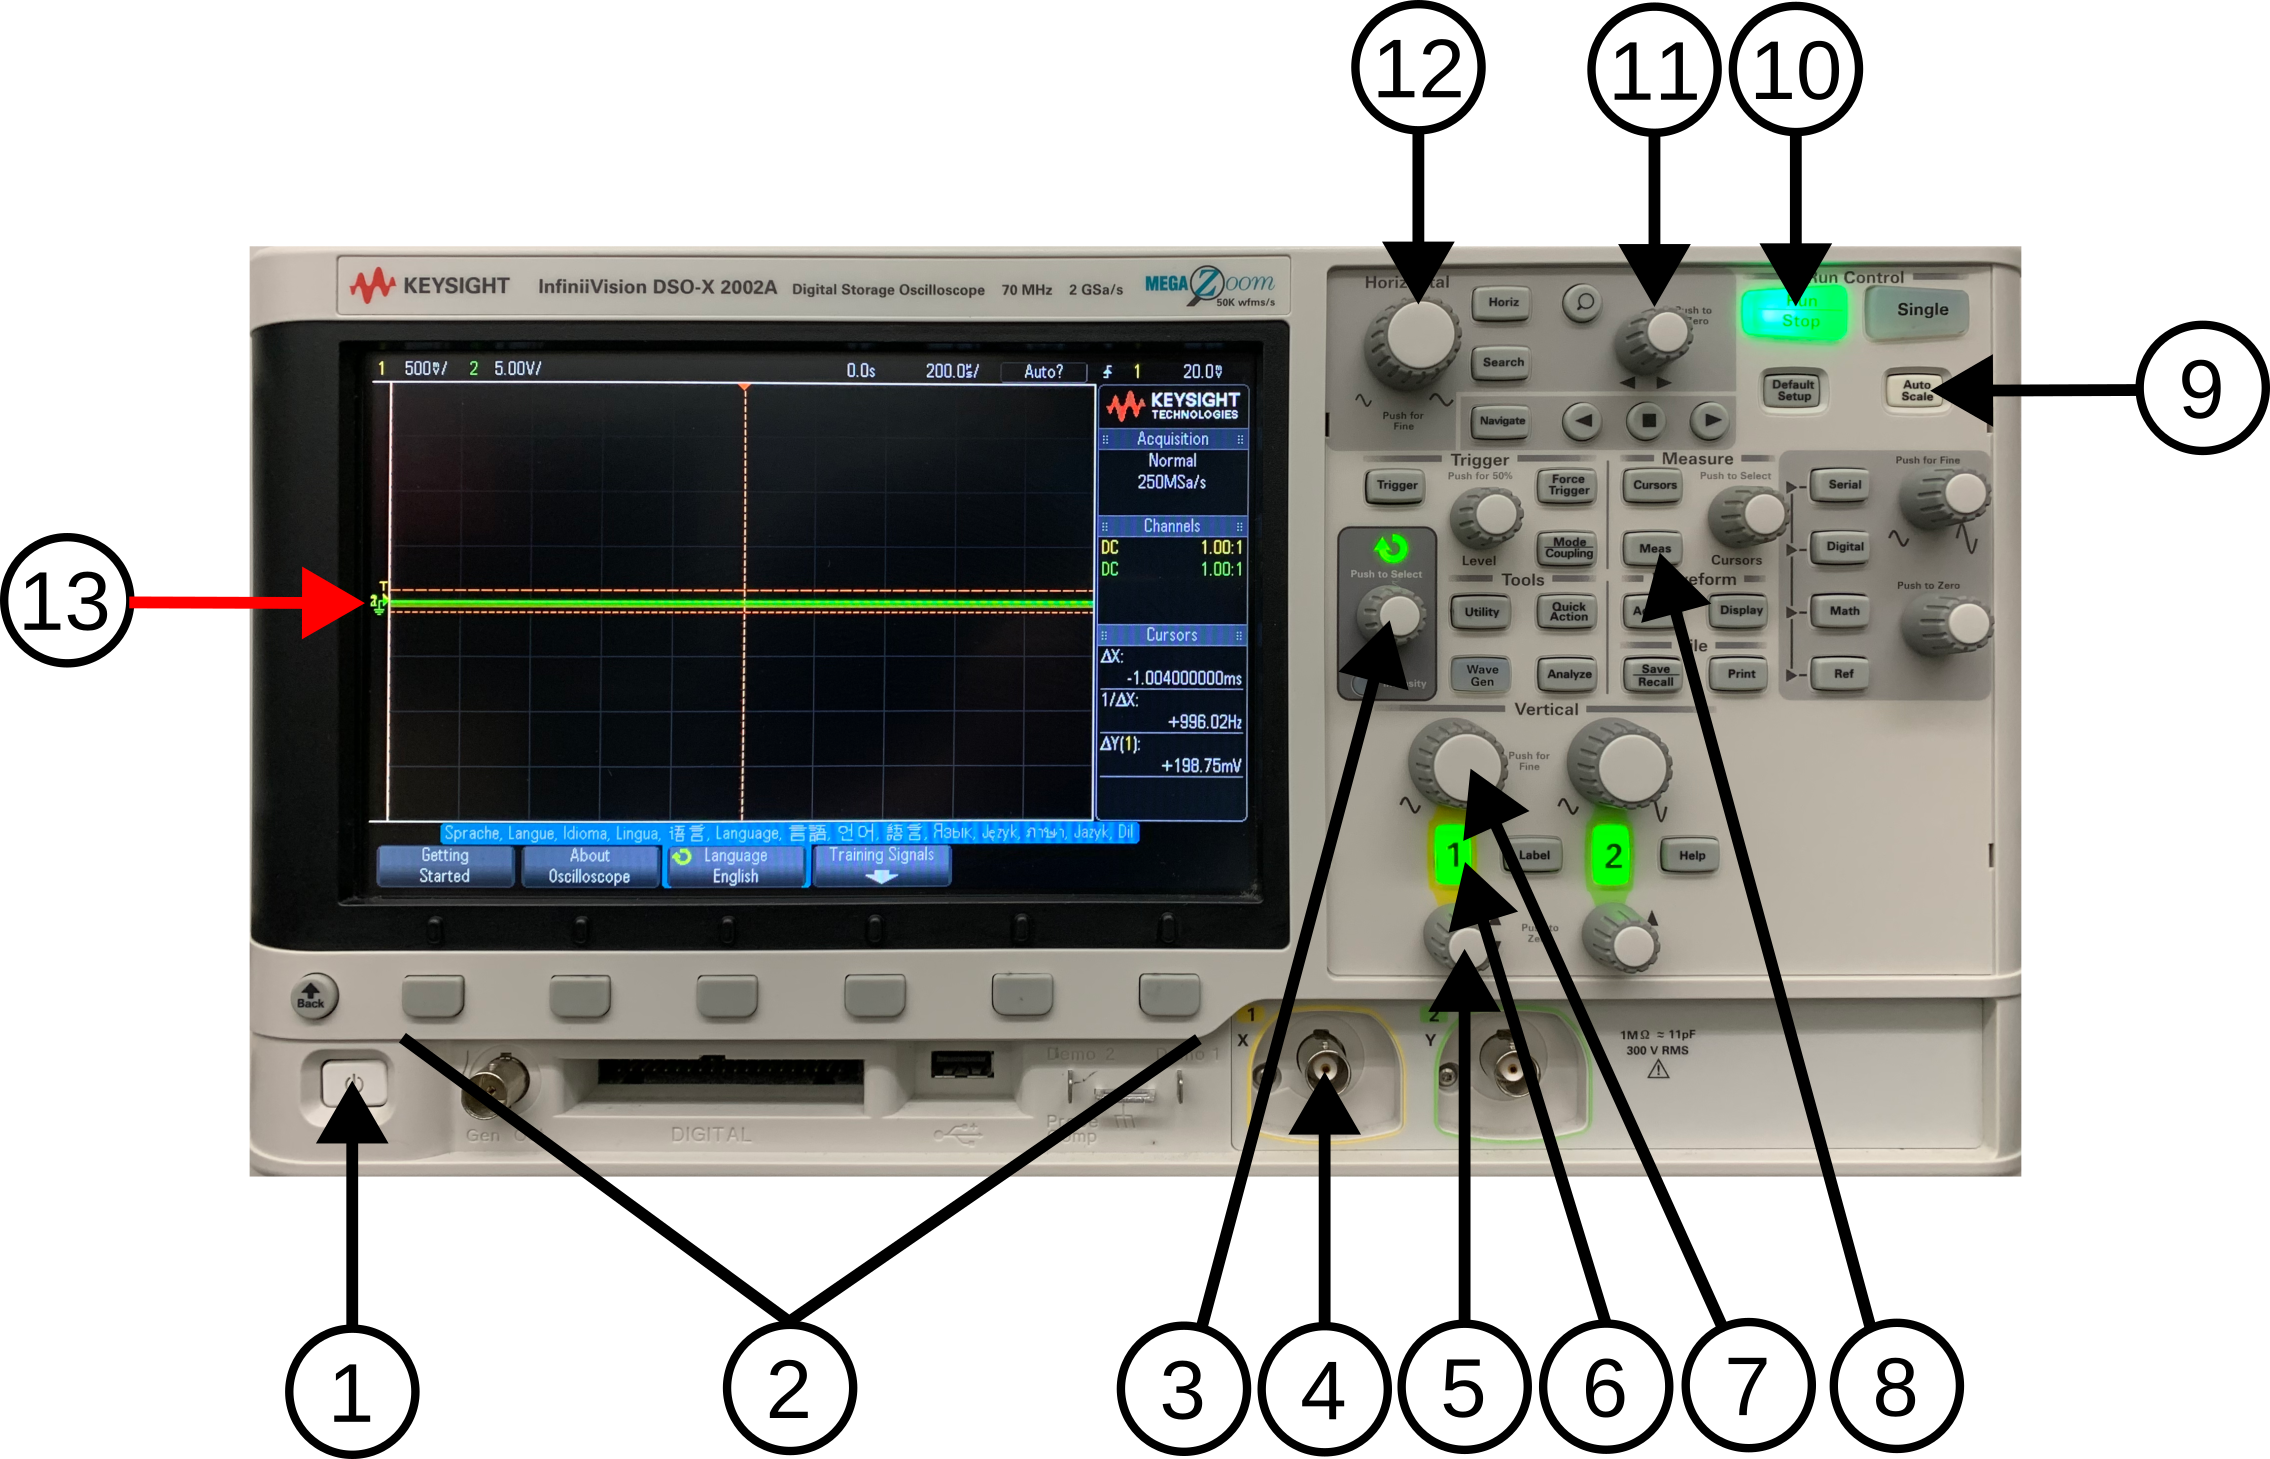 Figure 6.3
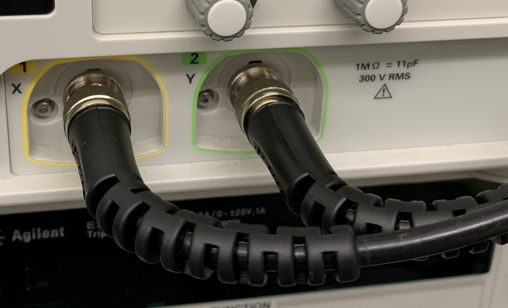 Figure 6.4
Lab Question 1: How many signal line(s) (6.3-13, bright solid horizontal line) do you see on the display? What is the colour of the line(s)?
Lab Question 2: How many signal line(s) do you see on the display? What is the colour of the line(s)?
WARNING: Ensure the exposed portion of the red alligator clip is NOT touching the exposed portion of the black alligator clip.
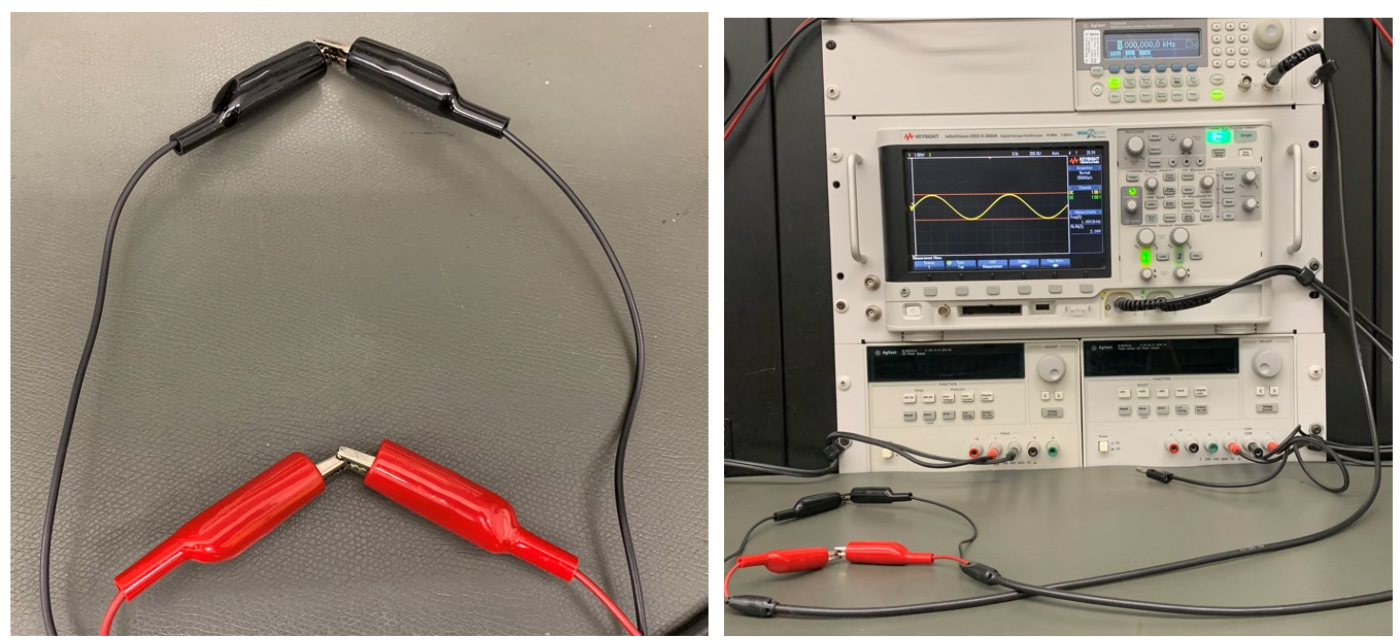 Figure 6.6
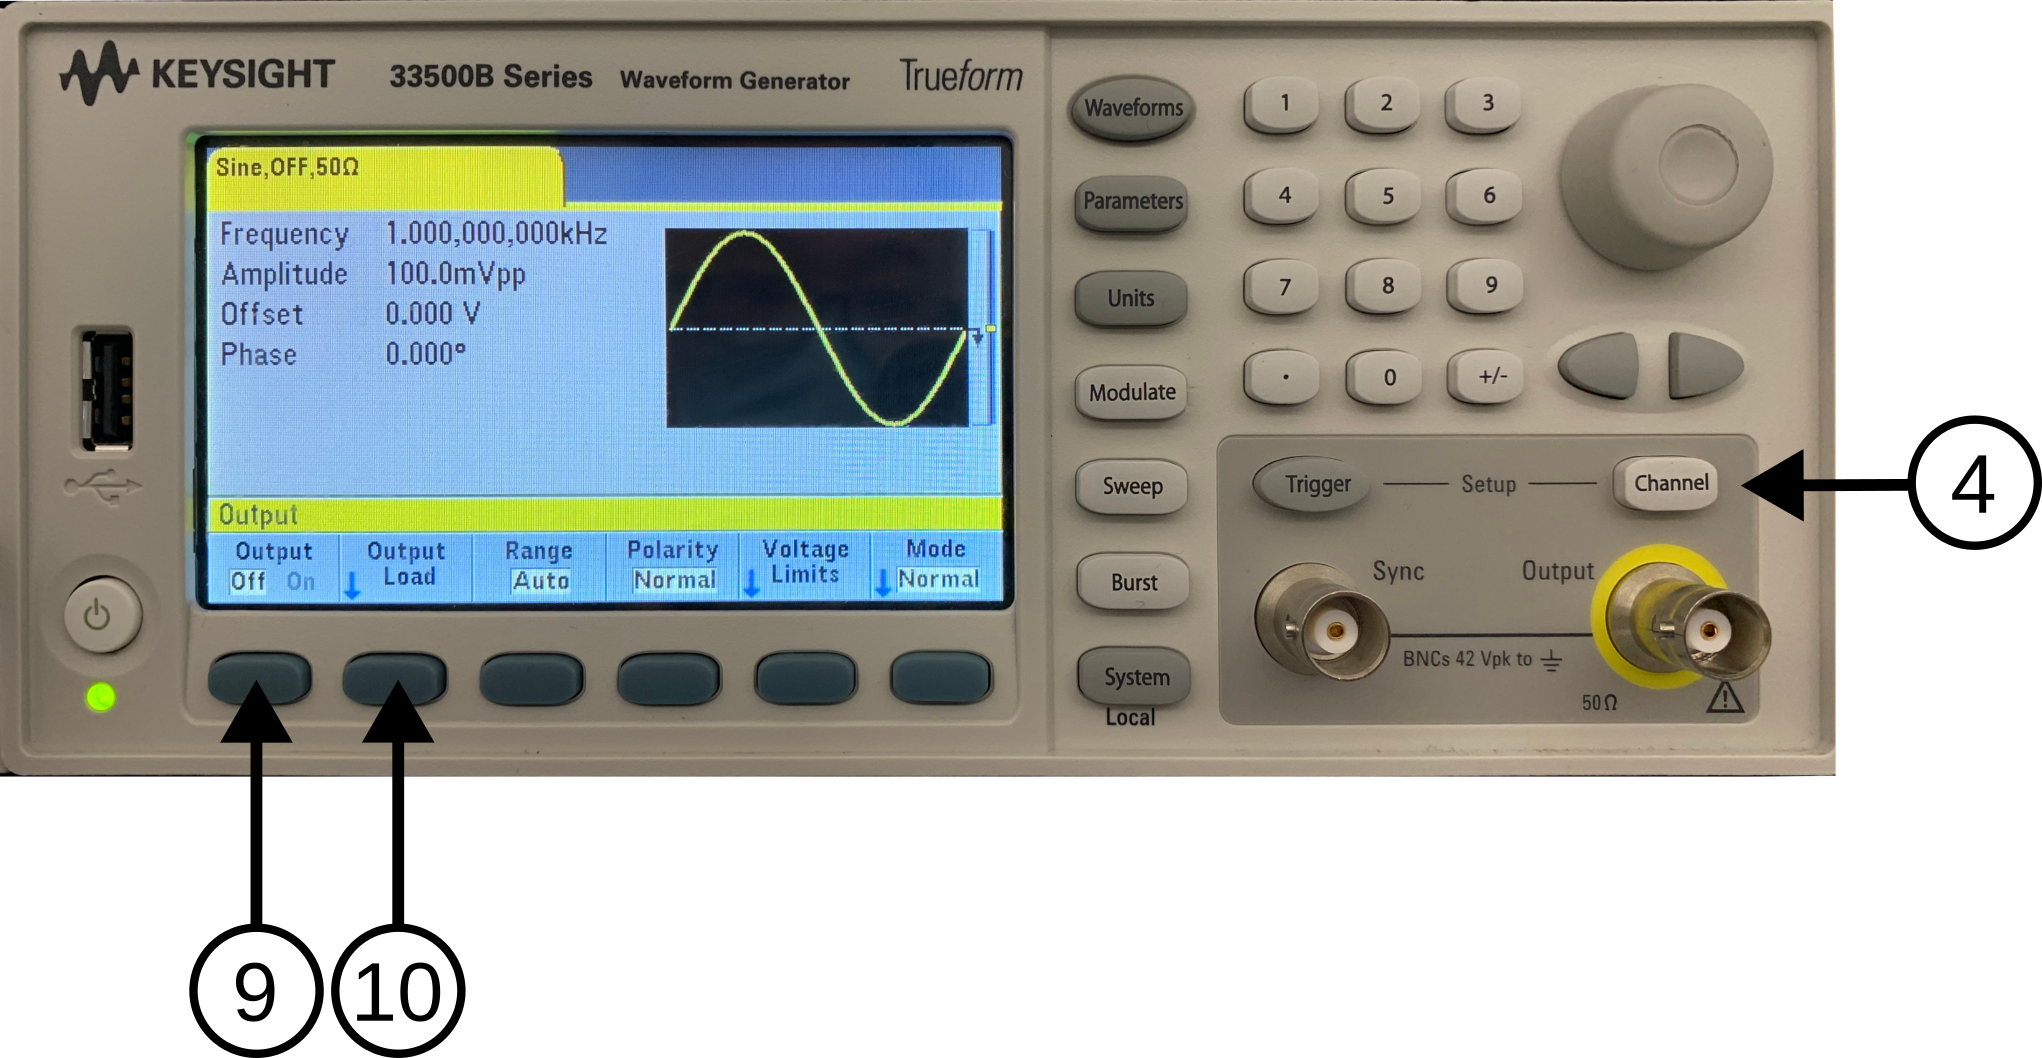 Figure 6.7
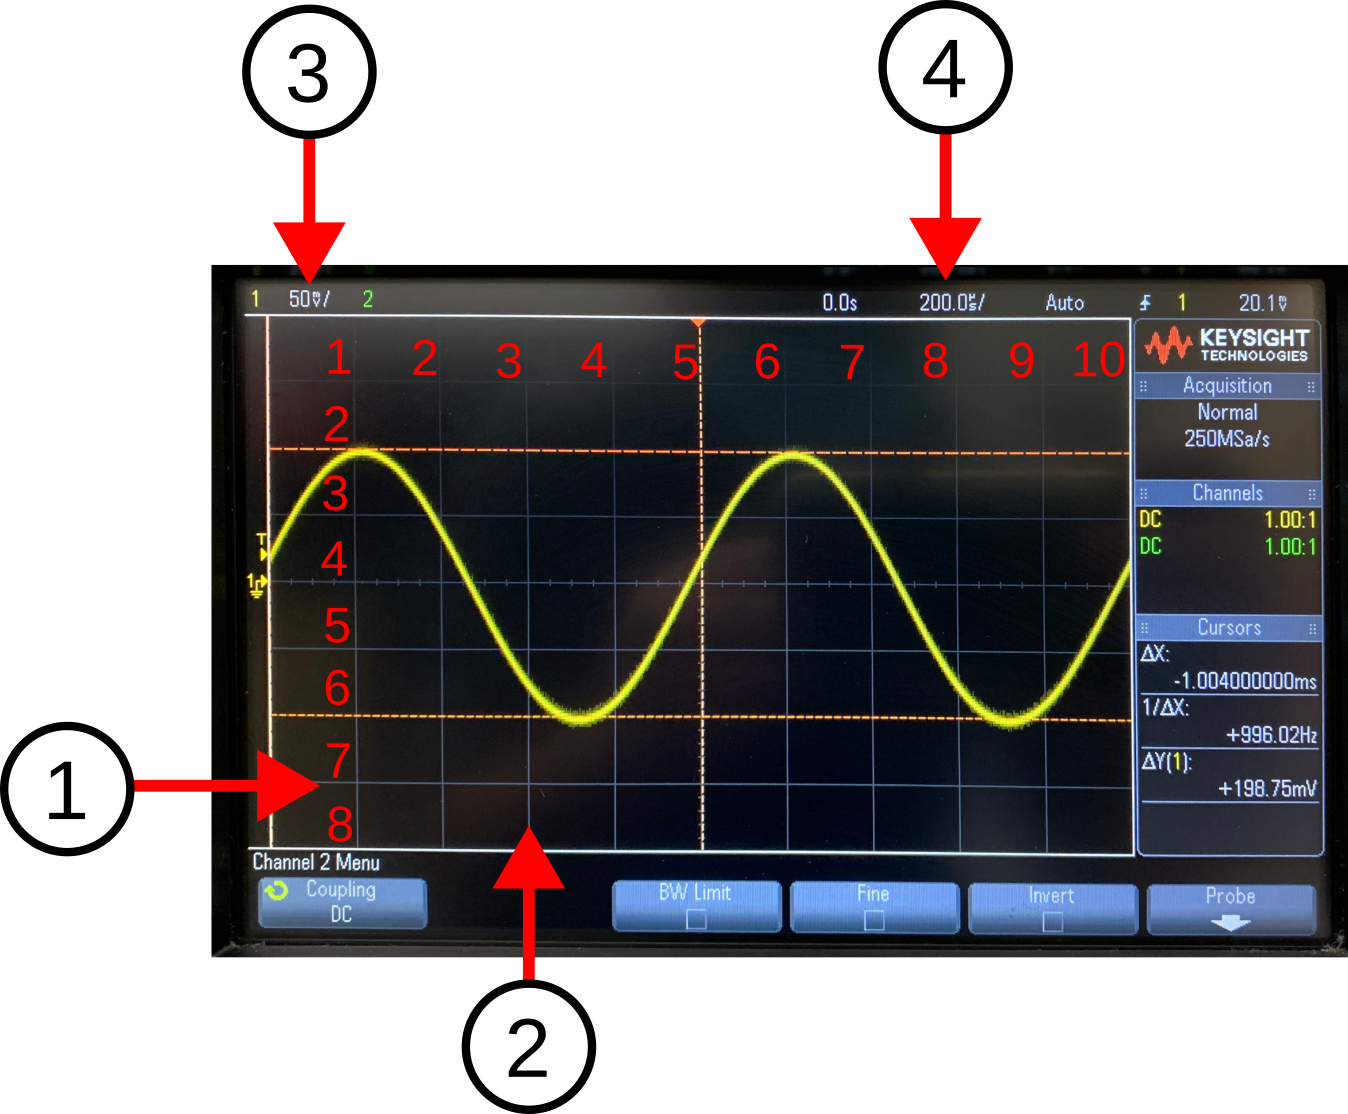 Figure 6.8
Lab Question 3: What effect do the time division knob and the horizontal position knob have on the waveform?
Lab Question 4: Find two peaks in the signal waveform then count the number of time divisions in each period of the sine wave. Afterward, calculate the frequency of the sine wave using: where is the frequency in [Hz] and is the period in [s]. Does it agree with the output of the function generator? You can adjust the horizontal position of the sine wave with the horizontal position knob to help with counting if necessary.
Lab Question 5: Does the frequency measurement agree with your calculation above?
Lab Question 6: At what time divisor does the measurement starts to become invalid? How many periods of the waveform are shown when it becomes invalid? What comment can you make on how the oscilloscope calculates the freq measurement (in terms of the waveform required to be displayed on the screen)?
Lab Question 7: Find the peak and the trough of the signal waveform. Count the number of voltage divisions from the peak to the trough of the sine wave then calculate the peak-to-peak voltage of the sine wave. Does it agree with the peak-to-peak voltage (Pk-Pk) value in the measurement list? Lab Question 8: Is this peak-to-peak voltage (Pk-Pk) value the same or different from the peak-to-peak voltage amplitude (Vpp) value you set at the function generator earlier? Describe how are they the same or different.
Lab Question 9: What is the voltage divisor value used to achieve this? Then, count the number of voltage divisions or read from the measurement list to find the peak-to-peak voltage of the signal. How does your result compare to the result in the measurements list and to the output setting of the function generator?
Lab Question 10: (During-Lab) Demostrate to the lab professor or instructor that you are competent in generating a wave signal from the function generator and manually scaling (non-using auto scale) the display of an oscilloscope to view such signal.
Once you've completed all the above steps, ask the lab professor or instructor over and demostrate you've completed the lab and written down all your observation. You might be asked to explain some of the concepts you've learned in this lab.